Transient MLS120609:102937+122453
RA           Dec (2000)
157.40326      12.41463
Rough Mag:
19.8
Discovery data
Current lightcurve
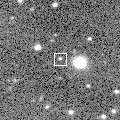
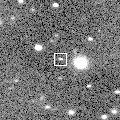
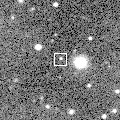
Pre and post-discovery MLS images
SDSS DR7
SDSS DR8
Images from other surveys
P60 Follow-up
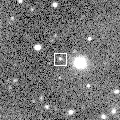
Pre-discovery 2' Mount Lemmon Survey coadd image (transient location marked with 0)
N is towards the top and E is to the left.
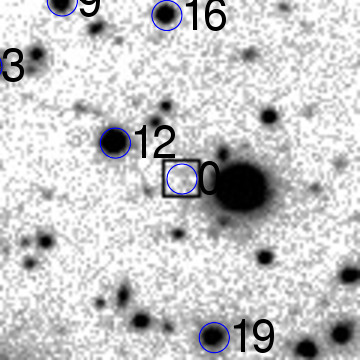
ID    RA         Dec (2000)      mag      delmag    delra (")    deldec (")  PA (deg)

0    157.40326      12.41463      19.8     0.0        0.0         0.0       0.0
9    157.41442      12.43054      18.9    -0.9       39.2        57.3      34.4
12    157.40953      12.41773      16.8    -3.0       22.0        11.2      63.1
16    157.40477      12.42922      18.4    -1.4        5.3        52.5       5.8
19    157.40043      12.40020      18.8    -1.0       -9.9       -51.9     190.8
21    157.39783      12.41352      16.1    -3.7      -19.1        -4.0     258.2
25    157.39520      12.42007      19.3    -0.5      -28.3        19.6     304.6
26    157.39132      12.39899      18.6    -1.2      -42.0       -56.3     216.7
27    157.38853      12.40049      18.7    -1.1      -51.8       -50.9     225.5
28    157.38778      12.40575      19.0    -0.8      -54.4       -32.0     239.6
| Image 1 | Image 2 |
 |
 |
| Image 3 | Image 4 |
 |
 |