Transient MLS140624:155710-194913
RA           Dec (2000)
239.29108      -19.82025
Rough Mag:
19.9
Discovery data
Current lightcurve
Pre and post-discovery MLS images
SDSS DR7
SDSS DR8
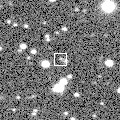
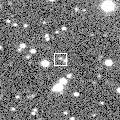
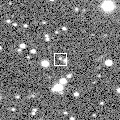
Images from other surveys
P60 Follow-up
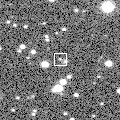
Pre-discovery 2' Mount Lemmon Survey coadd image (transient location marked with 0)
N is towards the top and E is to the left.
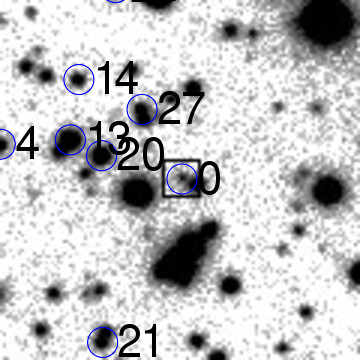
ID    RA         Dec (2000)      mag      delmag    delra (")    deldec (")  PA (deg)

0    239.29108     -19.82025      19.9     0.0        0.0         0.0       0.0
4    239.30857     -19.81723      19.2    -0.7       59.2        10.9      79.6
13    239.30187     -19.81685      17.6    -2.3       36.5        12.2      71.5
14    239.30103     -19.81143      19.4    -0.5       33.7        31.8      46.7
20    239.29890     -19.81828      18.1    -1.8       26.5         7.1      75.0
21    239.29886     -19.83506      19.3    -0.6       26.3       -53.3     153.7
26    239.29546     -19.82162      16.0    -3.9       14.8        -4.9     108.4
27    239.29502     -19.81413      19.3    -0.6       13.3        22.0      31.2
28    239.29480     -19.81503      19.4    -0.5       12.6        18.8      33.8
30    239.29351     -19.80398      16.8    -3.1        8.2        58.6       8.0
33    239.29164     -19.82810      15.1    -4.8        1.9       -28.3     176.2
35    239.29031     -19.82637      16.4    -3.5       -2.6       -22.0     186.8
36    239.29003     -19.81217      18.9    -0.9       -3.6        29.1     353.0
37    239.28977     -19.82089      19.1    -0.7       -4.4        -2.3     242.6
38    239.28971     -19.83489      19.3    -0.6       -4.6       -52.7     185.0
39    239.28859     -19.82499      18.6    -1.3       -8.4       -17.1     206.3
41    239.28777     -19.83653      18.8    -1.1      -11.2       -58.6     190.8
42    239.28652     -19.80703      19.4    -0.5      -15.4        47.6     342.0
43    239.28658     -19.82988      18.4    -1.5      -15.2       -34.7     203.7
46    239.28242     -19.80363      19.1    -0.8      -29.3        59.8     333.9
56    239.27744     -19.80616      13.5    -6.3      -46.2        50.7     317.7
57    239.27722     -19.82143      16.2    -3.7      -46.9        -4.2     264.8
58    239.27397     -19.82884      17.1    -2.8      -57.9       -30.9     241.9
| Image 1 | Image 2 |
 |
 |
| Image 3 | Image 4 |
 |
 |