Transient MLS140625:160805-205720
RA           Dec (2000)
242.02226      -20.95559
Rough Mag:
19.6
Discovery data
Current lightcurve
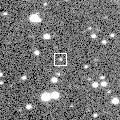
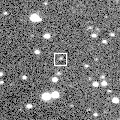
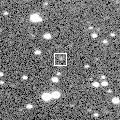
Pre and post-discovery MLS images
SDSS DR7
SDSS DR8
Images from other surveys
P60 Follow-up
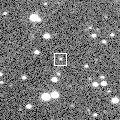
Pre-discovery 2' Mount Lemmon Survey coadd image (transient location marked with 0)
N is towards the top and E is to the left.
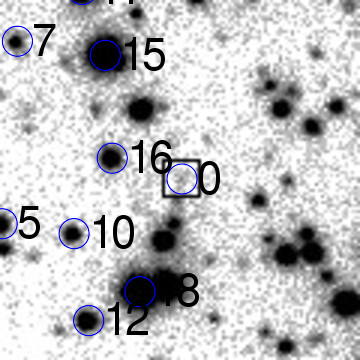
ID    RA         Dec (2000)      mag      delmag    delra (")    deldec (")  PA (deg)

0    242.02226     -20.95559      19.6     0.0        0.0         0.0       0.0
5    242.03971     -20.95972      18.6    -1.0       58.7       -14.9     104.2
7    242.03817     -20.94331      19.3    -0.3       53.5        44.2      50.4
10    242.03280     -20.96062      18.7    -0.9       35.4       -18.1     117.1
12    242.03143     -20.96844      18.0    -1.6       30.8       -46.3     146.3
15    242.02973     -20.94460      15.1    -4.5       25.1        39.6      32.4
16    242.02910     -20.95384      18.2    -1.4       23.0         6.3      74.7
18    242.02649     -20.96585      15.0    -4.7       14.2       -36.9     158.9
20    242.02617     -20.94949      17.2    -2.4       13.1        22.0      30.9
23    242.02403     -20.96123      17.5    -2.1        6.0       -20.3     163.7
24    242.02385     -20.96535      15.8    -3.8        5.3       -35.1     171.3
25    242.02290     -20.95963      19.3    -0.3        2.2       -14.5     171.6
28    242.02065     -20.93899      18.0    -1.7       -5.4        59.8     354.8
33    242.01484     -20.95760      19.4    -0.2      -24.9        -7.2     253.8
36    242.01388     -20.94731      19.4    -0.2      -28.2        29.8     316.6
38    242.01265     -20.94938      18.5    -1.1      -32.3        22.4     304.7
39    242.01233     -20.97076      19.1    -0.5      -33.4       -54.6     211.4
40    242.01223     -20.96255      17.6    -2.0      -33.7       -25.1     233.4
43    242.01021     -20.96060      19.2    -0.4      -40.5       -18.0     246.0
45    242.00978     -20.96231      17.7    -2.0      -42.0       -24.2     240.0
46    242.00964     -20.95104      18.9    -0.7      -42.4        16.4     291.1
50    242.00732     -20.94917      19.1    -0.5      -50.2        23.1     294.7
51    242.00651     -20.96689      16.6    -3.0      -52.9       -40.7     232.5
| Image 1 | Image 2 |
 |
 |
| Image 3 | Image 4 |
 |
 |