Transient MLS141104:080406+311305
RA           Dec (2000)
121.02604      31.21818
Rough Mag:
19.8
Discovery data
Current lightcurve
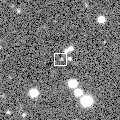
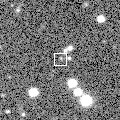
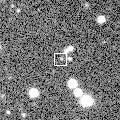
Pre and post-discovery MLS images
SDSS DR7
SDSS DR8
Images from other surveys
P60 Follow-up
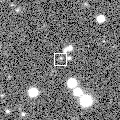
Pre-discovery 2' Mount Lemmon Survey coadd image (transient location marked with 0)
N is towards the top and E is to the left.
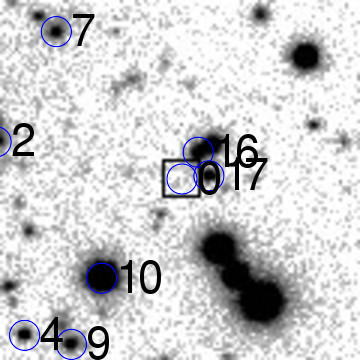
ID    RA         Dec (2000)      mag      delmag    delra (")    deldec (")  PA (deg)

0    121.02604      31.21818      19.8     0.0        0.0         0.0       0.0
4    121.04282      31.20410      19.4    -0.4       51.7       -50.7     134.5
7    121.03935      31.23131      19.4    -0.4       41.0        47.3      40.9
9    121.03789      31.20326      19.4    -0.3       36.5       -53.7     145.8
10    121.03469      31.20919      15.2    -4.6       26.6       -32.4     140.6
16    121.02448      31.22044      19.2    -0.6       -4.8         8.1     329.4
17    121.02337      31.21832      19.2    -0.5       -8.2         0.5     273.5
18    121.02307      31.22104      18.4    -1.4       -9.1        10.3     318.4
19    121.02243      31.21165      15.2    -4.6      -11.1       -23.5     205.3
21    121.02067      31.20927      15.9    -3.9      -16.5       -32.1     207.3
24    121.01803      31.20693      13.8    -6.0      -24.7       -40.5     211.3
25    121.01328      31.22888      16.3    -3.4      -39.3        38.5     314.4
| Image 1 | Image 2 |
 |
 |
| Image 3 | Image 4 |
 |
 |