Transient MLS141227:032404+321003
RA           Dec (2000)
51.01825      32.16760
Rough Mag:
20.6
Discovery data
Current lightcurve
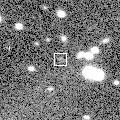
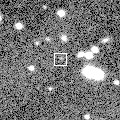
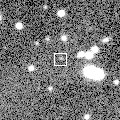
Pre and post-discovery MLS images
SDSS DR7
SDSS DR8
Images from other surveys
P60 Follow-up
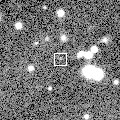
Pre-discovery 2' Mount Lemmon Survey coadd image (transient location marked with 0)
N is towards the top and E is to the left.
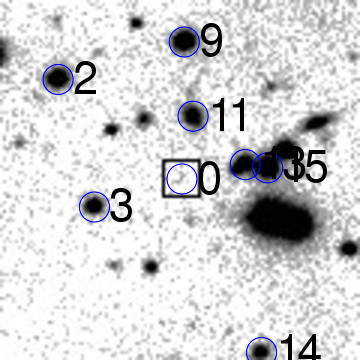
ID    RA         Dec (2000)      mag      delmag    delra (")    deldec (")  PA (deg)

0     51.01825      32.16760      20.6     0.0        0.0         0.0       0.0
2     51.03149      32.17650      17.4    -3.2       40.3        32.0      51.5
3     51.02771      32.16502      18.2    -2.4       28.8        -9.3     107.9
9     51.01809      32.17977      17.1    -3.4       -0.5        43.8     359.4
11     51.01720      32.17310      18.5    -2.0       -3.2        19.8     350.8
13     51.01169      32.16871      17.9    -2.6      -20.0         4.0     281.3
14     51.01007      32.15182      18.7    -1.8      -24.9       -56.8     203.7
15     51.00934      32.16840      16.6    -3.9      -27.2         2.9     276.1
16     51.00907      32.16395      14.1    -6.5      -28.0       -13.1     244.8
18     51.00744      32.16993      17.3    -3.3      -32.9         8.4     284.3
19     51.00650      32.16326      14.5    -6.0      -35.8       -15.6     246.4
21     51.00412      32.17241      18.6    -1.9      -43.1        17.3     291.9
22     51.00062      32.16108      18.8    -1.7      -53.7       -23.5     246.4
| Image 1 | Image 2 |
 |
 |
| Image 3 | Image 4 |
 |
 |