Transient SSS110125:073918-413635
RA           Dec (2000)
114.82411      -41.60978
Rough Mag:
17.0
Discovery data
Current lightcurve
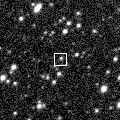
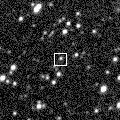
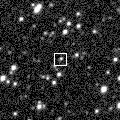
Pre and post-discovery SSS images
SDSS data
Images from other surveys
P60 Follow-up
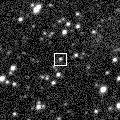
Pre-discovery 3.6' Siding Spring Survey coadd image (transient location marked with 0)
N is towards the top and E is to the left.
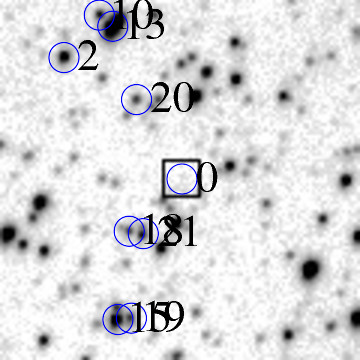
ID    RA         Dec (2000)      mag      delmag    delra (")    deldec (")  PA (deg)

0    114.82411     -41.60978      17.0     0.0        0.0         0.0       0.0
2    114.85034     -41.58953      16.2    -0.8       70.6        72.9      44.1
15    114.83915     -41.63326      15.3    -1.7       40.5       -84.5     154.4
18    114.83637     -41.61859      17.5     0.5       33.0       -31.7     133.9
19    114.83614     -41.63306      17.8     0.8       32.4       -83.8     158.9
20    114.83432     -41.59670      17.8     0.7       27.5        47.1      30.3
21    114.83324     -41.61904      17.1     0.0       24.6       -33.3     143.6
24    114.83009     -41.59723      17.3     0.3       16.1        45.2      19.6
26    114.82900     -41.62151      16.5    -0.6       13.2       -42.2     162.7
28    114.82802     -41.61397      17.4     0.4       10.5       -15.1     145.1
29    114.82556     -41.61748      16.1    -0.9        3.9       -27.7     172.0
31    114.82434     -41.59082      17.7     0.7        0.6        68.3       0.5
32    114.82196     -41.58987      17.9     0.8       -5.8        71.7     355.4
33    114.82118     -41.59625      15.6    -1.4       -7.9        48.7     350.8
36    114.81867     -41.59223      16.3    -0.7      -14.6        63.2     347.0
40    114.81375     -41.60794      16.6    -0.4      -27.9         6.6     283.4
41    114.81211     -41.58743      17.0    -0.1      -32.3        80.5     338.1
42    114.81218     -41.59349      16.3    -0.7      -32.1        58.6     331.3
47    114.80560     -41.61392      17.8     0.8      -49.8       -14.9     253.3
48    114.80147     -41.59644      17.0    -0.1      -60.9        48.0     308.2
51    114.79921     -41.60065      18.0     0.9      -67.0        32.9     296.1
53    114.79753     -41.59860      17.9     0.9      -71.5        40.2     299.4
55    114.79588     -41.62519      14.3    -2.8      -76.0       -55.5     233.9
| Image 1 | Image 2 |
 |
 |
| Image 3 | Image 4 |
 |
 |