Transient SSS111018:060601-313955
RA           Dec (2000)
91.50408      -31.66526
Rough Mag:
19.2
Discovery data
Current lightcurve
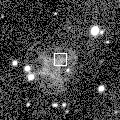
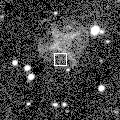
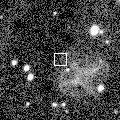
Pre and post-discovery SSS images
SDSS data
Images from other surveys
P60 Follow-up
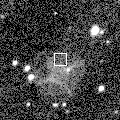
Pre-discovery 3.6' Siding Spring Survey coadd image (transient location marked with 0)
N is towards the top and E is to the left.
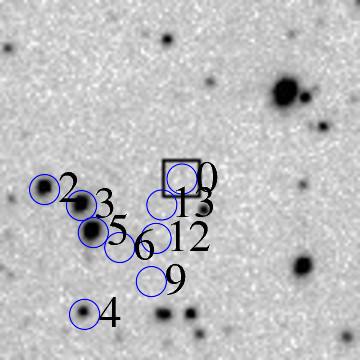
ID    RA         Dec (2000)      mag      delmag    delra (")    deldec (")  PA (deg)

0     91.50408     -31.66526      19.2     0.0        0.0         0.0       0.0
2     91.53127     -31.66711      16.2    -3.1       83.3        -6.7      94.6
3     91.52406     -31.66983      15.6    -3.6       61.2       -16.5     105.0
4     91.52360     -31.68793      17.7    -1.5       59.8       -81.6     143.8
5     91.52179     -31.67433      15.2    -4.0       54.3       -32.7     121.0
6     91.51663     -31.67684      17.3    -1.9       38.5       -41.7     137.3
8     91.51068     -31.66904      17.8    -1.4       20.2       -13.6     123.9
9     91.51050     -31.68255      17.2    -2.0       19.7       -62.2     162.5
11     91.50969     -31.66492      17.5    -1.7       17.2         1.2      85.9
12     91.50951     -31.67537      15.4    -3.8       16.6       -36.4     155.4
13     91.50835     -31.66981      17.0    -2.2       13.1       -16.4     141.4
14     91.50765     -31.68829      17.3    -1.9       10.9       -82.9     172.5
18     91.50251     -31.68811      17.5    -1.7       -4.8       -82.3     183.3
19     91.50192     -31.66421      17.3    -1.9       -6.6         3.8     299.7
20     91.50132     -31.67519      18.0    -1.3       -8.5       -35.7     193.3
23     91.50028     -31.67057      15.1    -4.1      -11.6       -19.1     211.3
24     91.49993     -31.68111      16.9    -2.3      -12.7       -57.1     192.6
26     91.49727     -31.67972      17.2    -2.0      -20.9       -52.1     201.8
28     91.48409     -31.65114      13.5    -5.7      -61.3        50.8     309.7
29     91.48063     -31.68017      15.5    -3.7      -71.9       -53.7     233.2
30     91.48033     -31.65205      17.2    -2.0      -72.8        47.6     303.2
| Image 1 | Image 2 |
 |
 |
| Image 3 | Image 4 |
 |
 |