Transient SSS120119:102706-434341
RA           Dec (2000)
156.77428      -43.72819
Rough Mag:
15.1
Discovery data
Current lightcurve
Pre and post-discovery SSS images
SDSS data
Images from other surveys
P60 Follow-up
Pre-discovery 3.6' Siding Spring Survey coadd image (transient location marked with 0)
N is towards the top and E is to the left.
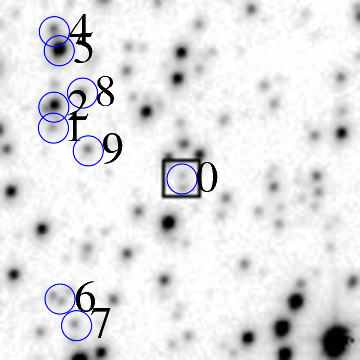
ID    RA         Dec (2000)      mag      delmag    delra (")    deldec (")  PA (deg)

0    156.77428     -43.72819      15.1     0.0        0.0         0.0       0.0
1    156.80415     -43.71979      17.9     2.8       77.7        30.2      68.7
2    156.80403     -43.71631      15.4     0.4       77.4        42.8      61.1
4    156.80379     -43.70374      17.2     2.1       76.8        88.0      41.1
5    156.80269     -43.70692      14.5    -0.5       73.9        76.6      44.0
6    156.80293     -43.74827      17.0     2.0       74.5       -72.3     134.1
7    156.79915     -43.75272      17.6     2.5       64.7       -88.3     143.8
8    156.79740     -43.71400      17.7     2.6       60.1        51.1      49.7
9    156.79618     -43.72363      17.4     2.3       57.0        16.4      73.9
10    156.79626     -43.74039      17.7     2.6       57.2       -43.9     127.5
14    156.79017     -43.74869      17.2     2.1       41.3       -73.8     150.7
15    156.78711     -43.71060      17.5     2.4       33.4        63.3      27.8
16    156.78707     -43.74102      16.9     1.8       33.3       -46.2     144.2
19    156.78447     -43.73406      17.3     2.2       26.5       -21.1     128.6
20    156.78248     -43.71729      15.5     0.4       21.3        39.2      28.5
22    156.77850     -43.74550      16.6     1.6       11.0       -62.3     170.0
23    156.77747     -43.72513      16.6     1.5        8.3        11.0      37.0
24    156.77750     -43.73592      14.6    -0.5        8.4       -27.8     163.2
26    156.77541     -43.71186      15.5     0.5        2.9        58.8       2.9
29    156.77456     -43.70753      15.6     0.5        0.7        74.4       0.6
30    156.77392     -43.72277      16.8     1.7       -0.9        19.5     357.3
34    156.77053     -43.71026      18.0     2.9       -9.8        64.5     351.4
35    156.77038     -43.72456      16.1     1.0      -10.1        13.1     322.2
39    156.76431     -43.73176      17.6     2.5      -25.9       -12.9     243.6
41    156.76008     -43.74289      17.6     2.5      -36.9       -52.9     214.9
46    156.75333     -43.72956      17.1     2.1      -54.5        -4.9     264.8
47    156.75318     -43.71601      18.0     2.9      -54.9        43.8     308.6
48    156.75195     -43.73599      17.9     2.8      -58.1       -28.1     244.2
52    156.74817     -43.74898      14.1    -1.0      -67.9       -74.8     222.2
| Image 1 | Image 2 |
 |
 |
| Image 3 | Image 4 |
 |
 |