Transient SSS120119:111329-501921
RA           Dec (2000)
168.37201      -50.32245
Rough Mag:
11.9
Discovery data
Current lightcurve
Pre and post-discovery SSS images
SDSS data
Images from other surveys
P60 Follow-up
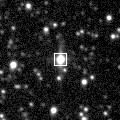
Pre-discovery 3.6' Siding Spring Survey coadd image (transient location marked with 0)
N is towards the top and E is to the left.
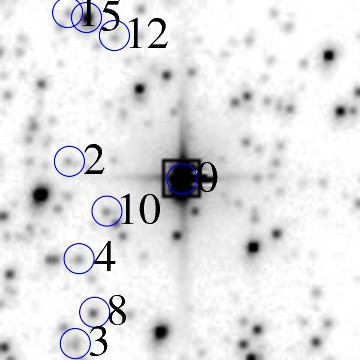
ID    RA         Dec (2000)      mag      delmag    delra (")    deldec (")  PA (deg)

0    168.37201     -50.32245      11.9     0.0        0.0         0.0       0.0
2    168.40169     -50.31949      17.6     5.7       68.2        10.7      81.1
4    168.39952     -50.33572      17.4     5.6       63.2       -47.8     127.1
8    168.39564     -50.34468      16.7     4.8       54.3       -80.0     145.8
10    168.39208     -50.32787      17.2     5.4       46.1       -19.5     112.9
12    168.38950     -50.29865      17.9     6.0       40.2        85.7      25.1
14    168.38953     -50.32970      16.4     4.6       40.3       -26.1     122.9
16    168.38784     -50.33184      17.1     5.2       36.4       -33.8     132.9
17    168.38643     -50.34486      17.9     6.0       33.1       -80.7     157.7
19    168.38324     -50.30752      15.0     3.2       25.8        53.7      25.7
25    168.37650     -50.30510      15.9     4.1       10.3        62.5       9.4
26    168.37365     -50.31092      16.9     5.0        3.8        41.5       5.2
27    168.37354     -50.33178      15.5     3.6        3.5       -33.6     174.0
28    168.37048     -50.31379      17.7     5.9       -3.5        31.2     353.6
29    168.36965     -50.30469      17.3     5.4       -5.4        63.9     355.2
30    168.36923     -50.32777      16.0     4.1       -6.4       -19.2     198.5
34    168.36108     -50.32565      17.9     6.1      -25.1       -11.5     245.4
35    168.35828     -50.30968      16.7     4.8      -31.6        46.0     325.5
39    168.35556     -50.31640      17.2     5.4      -37.8        21.8     299.9
40    168.35516     -50.30870      16.4     4.5      -38.7        49.5     322.0
43    168.35388     -50.33389      14.3     2.4      -41.7       -41.2     225.3
44    168.35348     -50.32868      17.3     5.4      -42.6       -22.4     242.2
45    168.35265     -50.32235      17.8     5.9      -44.5         0.4     270.5
53    168.34769     -50.31982      17.7     5.8      -55.9         9.5     279.6
54    168.34773     -50.33165      16.0     4.2      -55.8       -33.1     239.3
57    168.34472     -50.31071      16.6     4.7      -62.7        42.3     304.0
| Image 1 | Image 2 |
 |
 |
| Image 3 | Image 4 |
 |
 |