Transient SSS120322:123035-384823
RA           Dec (2000)
187.64618      -38.80650
Rough Mag:
15.8
Discovery data
Current lightcurve
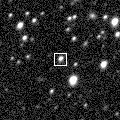
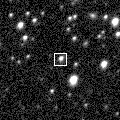
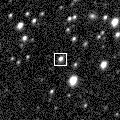
Pre and post-discovery SSS images
SDSS data
Images from other surveys
P60 Follow-up
Pre-discovery 3.6' Siding Spring Survey coadd image (transient location marked with 0)
N is towards the top and E is to the left.
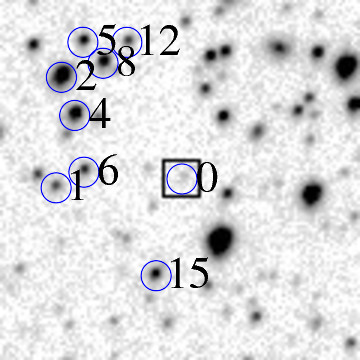
ID    RA         Dec (2000)      mag      delmag    delra (")    deldec (")  PA (deg)

0    187.64618     -38.80650      15.8     0.0        0.0         0.0       0.0
1    187.67340     -38.80808      17.7     1.9       76.4        -5.7      94.3
2    187.67211     -38.78968      14.9    -0.9       72.7        60.6      50.2
4    187.66933     -38.79605      15.9     0.1       64.9        37.6      59.9
5    187.66748     -38.78388      17.3     1.5       59.8        81.4      36.3
6    187.66744     -38.80550      17.7     1.9       59.6         3.6      86.5
8    187.66320     -38.78740      16.5     0.7       47.7        68.8      34.8
12    187.65809     -38.78394      17.7     1.9       33.4        81.2      22.4
15    187.65216     -38.82283      17.1     1.3       16.8       -58.8     164.1
18    187.64149     -38.79205      17.4     1.6      -13.2        52.0     345.8
20    187.64037     -38.78646      16.7     0.9      -16.3        72.1     347.3
22    187.63837     -38.81715      13.1    -2.7      -21.9       -38.3     209.7
23    187.63767     -38.79654      16.8     1.0      -23.9        35.9     326.3
24    187.63731     -38.78568      16.9     1.0      -24.9        75.0     341.6
25    187.63694     -38.80954      17.2     1.4      -25.9       -10.9     247.1
26    187.63081     -38.82965      17.6     1.8      -43.1       -83.3     207.4
27    187.63050     -38.79913      17.4     1.6      -44.0        26.5     301.1
28    187.62566     -38.78527      16.5     0.7      -57.6        76.4     323.0
29    187.62169     -38.79558      17.5     1.7      -68.7        39.3     299.8
30    187.61940     -38.79354      17.8     2.0      -75.1        46.7     301.8
32    187.61874     -38.80943      14.4    -1.4      -77.0       -10.5     262.2
34    187.61756     -38.78597      16.6     0.8      -80.3        73.9     312.6
| Image 1 | Image 2 |
 |
 |
| Image 3 | Image 4 |
 |
 |