Transient SSS120411:063645-182531
RA           Dec (2000)
99.18694      -18.42519
Rough Mag:
17.4
Discovery data
Current lightcurve
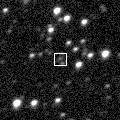
Pre and post-discovery SSS images
SDSS data
Images from other surveys
P60 Follow-up
Pre-discovery 3.6' Siding Spring Survey coadd image (transient location marked with 0)
N is towards the top and E is to the left.
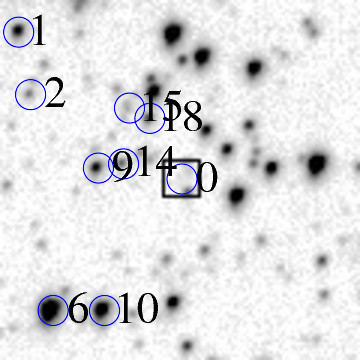
ID    RA         Dec (2000)      mag      delmag    delra (")    deldec (")  PA (deg)

0     99.18694     -18.42519      17.4     0.0        0.0         0.0       0.0
6     99.21009     -18.44705      13.2    -4.1       79.1       -78.7     134.9
9     99.20184     -18.42345      16.1    -1.2       50.9         6.3      83.0
10     99.20108     -18.44716      14.5    -2.9       48.3       -79.1     148.6
14     99.19742     -18.42281      17.4     0.0       35.8         8.6      76.5
15     99.19626     -18.41353      17.9     0.5       31.8        42.0      37.2
18     99.19270     -18.41529      17.0    -0.3       19.7        35.6      28.9
20     99.19177     -18.41057      14.9    -2.5       16.5        52.6      17.4
22     99.18837     -18.40116      13.7    -3.6        4.9        86.5       3.2
23     99.18857     -18.44608      15.4    -2.0        5.6       -75.2     175.8
24     99.18668     -18.40554      16.9    -0.4       -0.9        70.7     359.3
25     99.18582     -18.42760      17.3    -0.0       -3.8        -8.7     203.8
28     99.18323     -18.40497      14.3    -3.0      -12.7        72.8     350.1
29     99.18279     -18.43724      17.9     0.5      -14.2       -43.4     198.1
30     99.18246     -18.41735      16.1    -1.3      -15.3        28.2     331.5
31     99.17885     -18.42050      16.1    -1.3      -27.6        16.9     301.4
32     99.17724     -18.42825      14.4    -2.9      -33.1       -11.0     251.6
33     99.17496     -18.41660      16.5    -0.9      -40.9        30.9     307.1
34     99.17406     -18.40698      14.8    -2.6      -44.0        65.6     326.1
35     99.17414     -18.42279      17.1    -0.2      -43.7         8.6     281.2
37     99.17113     -18.42364      15.2    -2.1      -54.0         5.6     275.9
40     99.16414     -18.40032      17.0    -0.4      -77.9        89.5     319.0
41     99.16321     -18.42297      13.6    -3.8      -81.0         8.0     275.6
42     99.16231     -18.43914      17.2    -0.1      -84.1       -50.2     239.2
| Image 1 | Image 2 |
 |
 |
| Image 3 | Image 4 |
 |
 |