Transient SSS120411:143202-293605
RA           Dec (2000)
218.00982      -29.60129
Rough Mag:
19.0
Discovery data
Current lightcurve
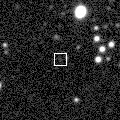
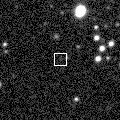
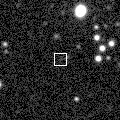
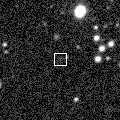
Pre and post-discovery SSS images
SDSS data
Images from other surveys
P60 Follow-up
Pre-discovery 3.6' Siding Spring Survey coadd image (transient location marked with 0)
N is towards the top and E is to the left.

ID    RA         Dec (2000)      mag      delmag    delra (")    deldec (")  PA (deg)

0    218.00982     -29.60129      19.0     0.0        0.0         0.0       0.0
3    218.01195     -29.59030      17.3    -1.7        6.7        39.6       9.6
6    218.00100     -29.62169      16.8    -2.2      -27.6       -73.4     200.6
8    217.99786     -29.57755      11.3    -7.7      -37.4        85.5     336.3
10    217.98931     -29.58585      16.9    -2.1      -64.2        55.6     310.9
11    217.98888     -29.59112      15.3    -3.7      -65.5        36.6     299.2
12    217.98831     -29.60151      15.0    -4.0      -67.3        -0.8     269.3
13    217.98593     -29.59637      15.1    -3.9      -74.8        17.7     283.3
15    217.98261     -29.60129      17.5    -1.5      -85.2         0.0     270.0
| Image 1 | Image 2 |
 |
 |
| Image 3 | Image 4 |
 |
 |