Transient SSS120424:111404-455104
RA           Dec (2000)
168.51769      -45.85102
Rough Mag:
18.2
Discovery data
Current lightcurve
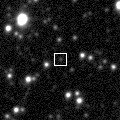
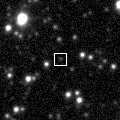
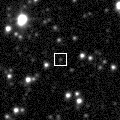
Pre and post-discovery SSS images
SDSS data
Images from other surveys
P60 Follow-up
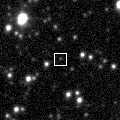
Pre-discovery 3.6' Siding Spring Survey coadd image (transient location marked with 0)
N is towards the top and E is to the left.
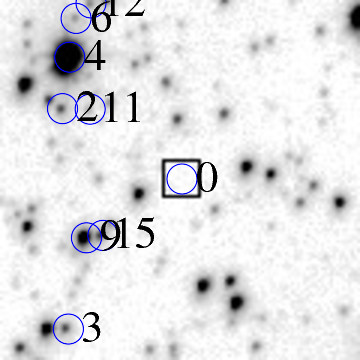
ID    RA         Dec (2000)      mag      delmag    delra (")    deldec (")  PA (deg)

0    168.51769     -45.85102      18.2     0.0        0.0         0.0       0.0
2    168.54622     -45.83911      16.5    -1.6       71.5        42.9      59.1
3    168.54599     -45.87581      16.7    -1.5       71.0       -89.2     141.5
4    168.54422     -45.83057      10.7    -7.5       66.5        73.6      42.1
9    168.54119     -45.86069      14.2    -3.9       58.9       -34.8     120.6
11    168.53962     -45.83930      17.7    -0.4       55.0        42.2      52.5
15    168.53725     -45.86036      16.8    -1.4       49.0       -33.6     124.4
17    168.53456     -45.83825      17.7    -0.5       42.3        46.0      42.6
18    168.53500     -45.85841      17.8    -0.4       43.4       -26.6     121.5
20    168.52839     -45.83201      17.5    -0.6       26.8        68.4      21.4
21    168.52794     -45.85355      15.3    -2.9       25.7        -9.1     109.5
23    168.52530     -45.83090      17.9    -0.3       19.1        72.4      14.8
26    168.52081     -45.83511      16.9    -1.2        7.8        57.3       7.8
29    168.51834     -45.84122      16.7    -1.4        1.6        35.3       2.6
32    168.51282     -45.86901      14.8    -3.4      -12.2       -64.8     190.7
33    168.50978     -45.85627      17.8    -0.3      -19.8       -18.9     226.4
35    168.50717     -45.84043      17.0    -1.2      -26.4        38.1     325.3
36    168.50638     -45.86832      15.8    -2.4      -28.4       -62.3     204.5
37    168.50495     -45.87190      14.4    -3.8      -31.9       -75.2     203.0
38    168.50202     -45.84933      15.1    -3.0      -39.3         6.1     278.8
44    168.49630     -45.85061      15.9    -2.3      -53.6         1.5     271.6
48    168.48936     -45.85540      17.2    -1.0      -71.0       -15.8     257.5
| Image 1 | Image 2 |
 |
 |
| Image 3 | Image 4 |
 |
 |