Transient SSS120424:135144-443020
RA           Dec (2000)
207.93134      -44.50542
Rough Mag:
15.8
Discovery data
Current lightcurve
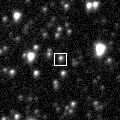
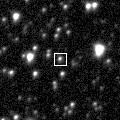
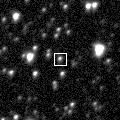
Pre and post-discovery SSS images
SDSS data
Images from other surveys
P60 Follow-up
Pre-discovery 3.6' Siding Spring Survey coadd image (transient location marked with 0)
N is towards the top and E is to the left.
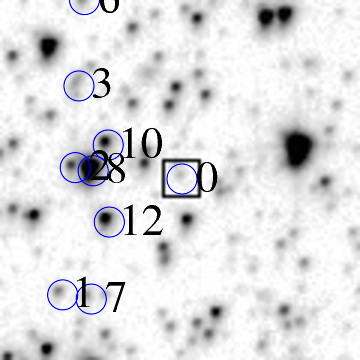
ID    RA         Dec (2000)      mag      delmag    delra (")    deldec (")  PA (deg)

0    207.93134     -44.50542      15.8     0.0        0.0         0.0       0.0
1    207.96010     -44.52451      17.5     1.6       73.8       -68.7     132.9
2    207.95652     -44.50340      16.8     0.9       64.6         7.3      83.6
3    207.95525     -44.48982      17.2     1.3       61.4        56.2      47.5
7    207.95347     -44.52531      17.8     1.9       56.8       -71.6     141.6
8    207.95238     -44.50398      13.1    -2.7       54.0         5.2      84.5
10    207.94873     -44.49975      15.8    -0.1       44.6        20.4      65.4
12    207.94885     -44.51257      15.3    -0.5       45.0       -25.7     119.8
17    207.94189     -44.48083      17.0     1.2       27.1        88.5      17.0
18    207.94217     -44.49345      17.2     1.3       27.8        43.1      32.8
19    207.93945     -44.50325      16.2     0.4       20.8         7.8      69.4
20    207.93907     -44.50134      17.5     1.6       19.8        14.7      53.5
21    207.93846     -44.48838      17.8     2.0       18.3        61.3      16.6
23    207.93589     -44.48580      17.9     2.0       11.7        70.6       9.4
25    207.93528     -44.51829      16.1     0.2       10.1       -46.3     167.7
26    207.93354     -44.49375      16.6     0.7        5.6        42.0       7.7
28    207.93194     -44.49081      16.4     0.6        1.5        52.6       1.7
31    207.92986     -44.51295      15.8    -0.1       -3.8       -27.1     188.0
34    207.92670     -44.48883      17.5     1.7      -11.9        59.7     348.7
35    207.92780     -44.53005      17.2     1.4       -9.1       -88.7     185.9
36    207.92511     -44.49218      16.8     0.9      -16.0        47.7     341.4
38    207.92345     -44.52841      16.0     0.1      -20.3       -82.8     193.8
39    207.92159     -44.50796      17.0     1.2      -25.0        -9.1     249.9
48    207.90748     -44.52832      16.7     0.9      -61.3       -82.4     216.6
52    207.90379     -44.50112      11.7    -4.2      -70.7        15.5     282.3
53    207.90409     -44.53007      17.6     1.8      -70.0       -88.7     218.3
54    207.90267     -44.52039      18.0     2.2      -73.6       -53.9     233.8
| Image 1 | Image 2 |
 |
 |
| Image 3 | Image 4 |
 |
 |