Transient SSS120501:141015-303726
RA           Dec (2000)
212.56408      -30.62393
Rough Mag:
17.4
Discovery data
Current lightcurve
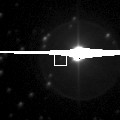
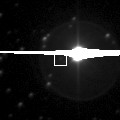
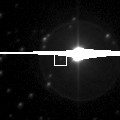
Pre and post-discovery SSS images
SDSS data
Images from other surveys
P60 Follow-up
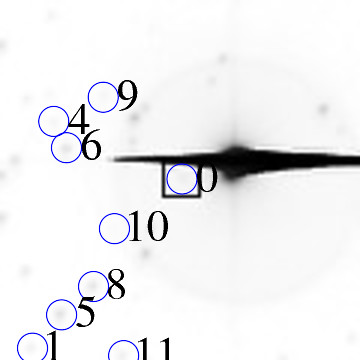
Pre-discovery 3.6' Siding Spring Survey coadd image (transient location marked with 0)
N is towards the top and E is to the left.
ID    RA         Dec (2000)      mag      delmag    delra (")    deldec (")  PA (deg)

0    212.56408     -30.62393      17.4     0.0        0.0         0.0       0.0
4    212.58910     -30.61444      17.8     0.4       77.5        34.2      66.2
5    212.58785     -30.64665      16.0    -1.4       73.6       -81.8     138.0
6    212.58667     -30.61884      16.9    -0.5       70.0        18.3      75.3
8    212.58163     -30.64197      16.2    -1.1       54.4       -64.9     140.1
9    212.57950     -30.61048      17.2    -0.1       47.8        48.4      44.6
10    212.57750     -30.63236      17.2    -0.2       41.6       -30.3     126.1
12    212.57465     -30.61000      17.4     0.0       32.7        50.1      33.1
13    212.57450     -30.62831      16.4    -1.0       32.3       -15.8     116.0
14    212.57387     -30.61784      16.1    -1.2       30.3        21.9      54.1
15    212.57295     -30.61366      14.0    -3.3       27.5        37.0      36.6
17    212.57127     -30.63653      14.8    -2.6       22.3       -45.4     153.8
19    212.57043     -30.63241      15.2    -2.2       19.7       -30.5     147.2
21    212.56875     -30.64382      17.7     0.4       14.5       -71.6     168.6
22    212.56838     -30.60434      17.3    -0.1       13.3        70.5      10.7
23    212.56763     -30.62508      17.2    -0.1       11.0        -4.1     110.6
24    212.56682     -30.61585      17.8     0.4        8.5        29.1      16.3
25    212.56486     -30.60147      17.5     0.1        2.4        80.9       1.7
26    212.56393     -30.64176      16.8    -0.5       -0.5       -64.2     180.4
27    212.56047     -30.60107      16.8    -0.6      -11.2        82.3     352.3
28    212.56074     -30.64295      17.2    -0.1      -10.3       -68.5     188.6
29    212.55845     -30.60787      14.4    -3.0      -17.4        57.8     343.2
30    212.55638     -30.60417      15.3    -2.0      -23.9        71.1     341.5
33    212.55431     -30.64403      16.3    -1.0      -30.3       -72.4     202.7
37    212.54798     -30.60619      16.0    -1.4      -49.9        63.9     322.0
39    212.54485     -30.60713      17.3    -0.1      -59.6        60.5     315.4
40    212.54361     -30.60395      16.6    -0.8      -63.4        71.9     318.6
41    212.54300     -30.62123       7.2   -10.1      -65.3         9.7     278.5
42    212.54227     -30.64212      16.6    -0.8      -67.6       -65.5     225.9
43    212.54138     -30.63873      17.2    -0.2      -70.3       -53.3     232.9
48    212.53702     -30.61271      14.5    -2.9      -83.8        40.4     295.7
51    212.53582     -30.62896      15.9    -1.5      -87.5       -18.1     258.3
| Image 1 | Image 2 |
 |
 |
| Image 3 | Image 4 |
 |
 |