Transient SSS120522:135600-450247
RA           Dec (2000)
208.99871      -45.04650
Rough Mag:
18.4
Discovery data
Current lightcurve
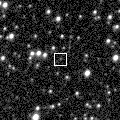
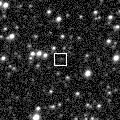
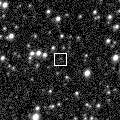
Pre and post-discovery SSS images
SDSS data
Images from other surveys
P60 Follow-up
Pre-discovery 3.6' Siding Spring Survey coadd image (transient location marked with 0)
N is towards the top and E is to the left.
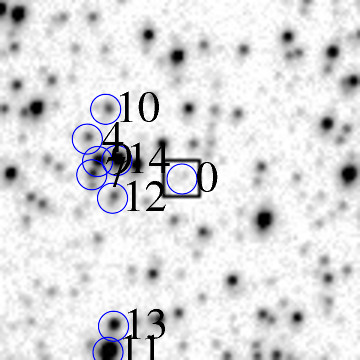
ID    RA         Dec (2000)      mag      delmag    delra (")    deldec (")  PA (deg)

0    208.99871     -45.04650      18.4     0.0        0.0         0.0       0.0
4    209.02139     -45.04010      17.9    -0.5       57.7        23.0      68.2
7    209.02032     -45.04605      17.3    -1.1       55.0         1.6      88.3
9    209.01896     -45.04384      16.0    -2.4       51.5         9.6      79.5
10    209.01706     -45.03514      17.6    -0.8       46.7        40.9      48.8
12    209.01543     -45.04994      17.6    -0.8       42.5       -12.4     106.2
13    209.01518     -45.07126      16.4    -2.0       41.9       -89.1     154.8
14    209.01440     -45.04366      15.4    -3.0       39.9        10.2      75.6
15    209.01004     -45.04458      16.1    -2.4       28.8         6.9      76.5
17    209.00749     -45.02306      16.6    -1.8       22.3        84.4      14.8
19    209.00612     -45.06270      17.3    -1.1       18.8       -58.3     162.1
20    209.00483     -45.07041      17.0    -1.4       15.6       -86.1     169.7
21    209.00411     -45.04123      17.0    -1.4       13.7        19.0      35.9
23    209.00061     -45.02649      15.7    -2.7        4.8        72.0       3.8
24    209.00001     -45.06928      17.8    -0.6        3.3       -82.0     177.7
27    208.99792     -45.03521      17.2    -1.2       -2.0        40.6     357.2
31    208.99419     -45.05587      17.4    -1.0      -11.5       -33.7     198.8
34    208.98731     -45.06394      16.9    -1.5      -29.0       -62.8     204.8
36    208.98503     -45.02531      17.9    -0.6      -34.8        76.3     335.5
39    208.98069     -45.04484      17.7    -0.7      -45.8         6.0     277.4
40    208.97993     -45.05361      14.8    -3.6      -47.8       -25.6     241.8
41    208.97946     -45.06977      17.2    -1.3      -49.0       -83.8     210.3
43    208.97468     -45.02318      16.9    -1.6      -61.1        84.0     323.9
44    208.97304     -45.02601      17.4    -1.0      -65.3        73.8     318.5
46    208.97203     -45.06994      17.1    -1.3      -67.9       -84.4     218.8
| Image 1 | Image 2 |
 |
 |
| Image 3 | Image 4 |
 |
 |