Transient SSS120715:195551-260249
RA           Dec (2000)
298.96193      -26.04701
Rough Mag:
18.4
Discovery data
Current lightcurve
Pre and post-discovery SSS images
SDSS data
Images from other surveys
P60 Follow-up
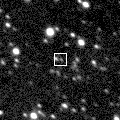
Pre-discovery 3.6' Siding Spring Survey coadd image (transient location marked with 0)
N is towards the top and E is to the left.
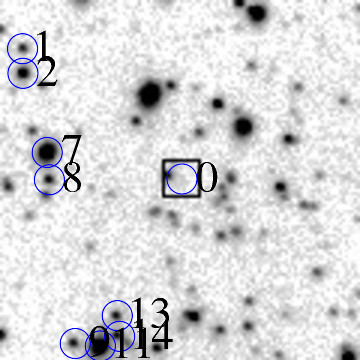
ID    RA         Dec (2000)      mag      delmag    delra (")    deldec (")  PA (deg)

0    298.96193     -26.04701      18.4     0.0        0.0         0.0       0.0
7    298.98718     -26.04275      14.3    -4.1       81.7        15.3      79.4
8    298.98679     -26.04730      17.2    -1.2       80.4        -1.0      90.7
13    298.97429     -26.06997      17.5    -0.9       40.0       -82.7     154.2
15    298.97071     -26.03756      17.5    -0.9       28.4        34.0      39.9
16    298.96815     -26.03306      13.3    -5.1       20.1        50.2      21.8
19    298.96479     -26.04664      17.3    -1.1        9.3         1.3      81.8
20    298.96447     -26.03154      17.5    -0.9        8.2        55.7       8.4
22    298.96379     -26.05367      17.9    -0.4        6.0       -24.0     165.9
24    298.96017     -26.07017      16.1    -2.2       -5.7       -83.4     183.9
27    298.95557     -26.03469      16.7    -1.7      -20.6        44.4     335.1
30    298.95454     -26.04964      17.1    -1.2      -23.9        -9.5     248.4
32    298.95309     -26.04715      17.6    -0.8      -28.6        -0.5     269.0
33    298.95212     -26.05600      17.8    -0.6      -31.7       -32.4     224.4
35    298.95085     -26.03844      14.6    -3.8      -35.8        30.9     310.7
36    298.94980     -26.07171      17.7    -0.6      -39.2       -88.9     203.8
41    298.94378     -26.04870      16.7    -1.6      -58.7        -6.1     264.1
42    298.94220     -26.04059      17.0    -1.3      -63.8        23.1     289.9
45    298.93882     -26.05157      17.8    -0.6      -74.7       -16.4     257.6
| Image 1 | Image 2 |
 |
 |
| Image 3 | Image 4 |
 |
 |