Transient SSS120810:141755-383632
RA           Dec (2000)
214.48071      -38.60902
Rough Mag:
17.3
Discovery data
Current lightcurve
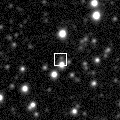
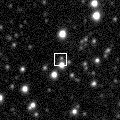
Pre and post-discovery SSS images
SDSS data
Images from other surveys
P60 Follow-up
Pre-discovery 3.6' Siding Spring Survey coadd image (transient location marked with 0)
N is towards the top and E is to the left.
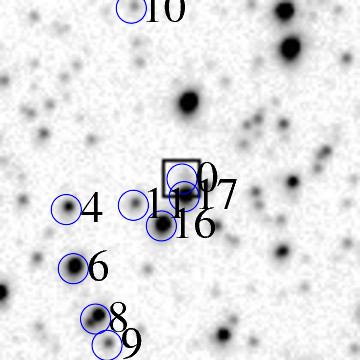
ID    RA         Dec (2000)      mag      delmag    delra (")    deldec (")  PA (deg)

0    214.48071     -38.60902      17.3     0.0        0.0         0.0       0.0
4    214.50563     -38.61450      16.1    -1.1       70.1       -19.7     105.7
6    214.50404     -38.62433      14.3    -3.0       65.6       -55.1     130.0
8    214.49920     -38.63268      14.8    -2.5       52.0       -85.2     148.6
11    214.49134     -38.61370      16.8    -0.5       29.9       -16.8     119.4
16    214.48534     -38.61711      14.1    -3.2       13.0       -29.1     155.9
17    214.48053     -38.61220      14.3    -3.0       -0.5       -11.4     182.5
18    214.48022     -38.59668      13.3    -4.0       -1.4        44.4     358.2
19    214.47602     -38.61077      17.2    -0.1      -13.2        -6.3     244.5
20    214.47399     -38.61732      16.9    -0.4      -18.9       -29.9     212.3
24    214.47044     -38.61961      17.9     0.6      -28.9       -38.1     217.2
25    214.46851     -38.60362      17.5     0.2      -34.3        19.4     299.5
26    214.46761     -38.60055      17.9     0.6      -36.9        30.5     309.6
29    214.46572     -38.61161      17.1    -0.2      -42.2        -9.3     257.5
30    214.46545     -38.59944      17.1    -0.2      -42.9        34.5     308.8
32    214.46496     -38.61369      18.0     0.7      -44.3       -16.8     249.2
36    214.45994     -38.62146      15.9    -1.4      -58.4       -44.8     232.5
37    214.46007     -38.60038      17.0    -0.3      -58.1        31.1     298.2
39    214.45862     -38.58743      13.0    -4.3      -62.1        77.7     321.4
40    214.45795     -38.60991      15.7    -1.5      -64.0        -3.2     267.1
43    214.45267     -38.60744      18.0     0.7      -78.9         5.7     274.1
44    214.45118     -38.60483      16.6    -0.7      -83.1        15.1     280.3
| Image 1 | Image 2 |
 |
 |
| Image 3 | Image 4 |
 |
 |