Transient SSS121217:062754-200330
RA           Dec (2000)
96.97463      -20.05828
Rough Mag:
16.9
Discovery data
Current lightcurve
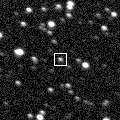
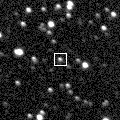
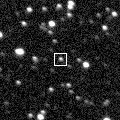
Pre and post-discovery SSS images
SDSS data
Images from other surveys
P60 Follow-up
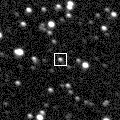
Pre-discovery 3.6' Siding Spring Survey coadd image (transient location marked with 0)
N is towards the top and E is to the left.
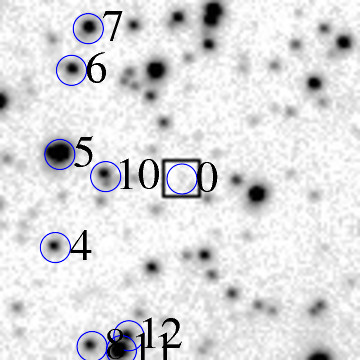
ID    RA         Dec (2000)      mag      delmag    delra (")    deldec (")  PA (deg)

0     96.97463     -20.05828      16.9     0.0        0.0         0.0       0.0
4     96.99748     -20.06968      17.0     0.2       77.3       -41.0     118.0
5     96.99650     -20.05420      14.1    -2.8       74.0        14.7      78.8
6     96.99425     -20.04021      16.5    -0.4       66.3        65.1      45.6
7     96.99120     -20.03331      15.9    -0.9       56.0        89.9      31.9
10     96.98842     -20.05798      16.6    -0.3       46.6         1.1      88.7
14     96.98376     -20.04265      17.7     0.8       30.9        56.3      28.8
18     96.98027     -20.04467      17.2     0.3       19.1        49.0      21.3
19     96.98011     -20.07339      17.0     0.1       18.5       -54.4     161.2
20     96.97933     -20.04052      14.7    -2.2       15.9        63.9      14.0
22     96.97794     -20.04920      17.7     0.8       11.2        32.7      18.9
26     96.97080     -20.07128      16.9     0.1      -13.0       -46.8     195.5
29     96.96997     -20.03617      16.4    -0.5      -15.8        79.6     348.8
32     96.96951     -20.07451      17.9     1.0      -17.3       -58.4     196.5
33     96.96592     -20.07779      17.7     0.9      -29.5       -70.2     202.8
34     96.96507     -20.05888      17.5     0.6      -32.3        -2.2     266.2
35     96.96145     -20.06116      14.8    -2.1      -44.6       -10.4     256.9
40     96.95449     -20.03639      18.0     1.1      -68.1        78.8     319.2
41     96.95124     -20.04279      16.2    -0.7      -79.1        55.8     305.2
43     96.95075     -20.08025      17.3     0.4      -80.8       -79.1     225.6
45     96.94943     -20.03369      17.7     0.8      -85.2        88.5     316.1
| Image 1 | Image 2 |
 |
 |
| Image 3 | Image 4 |
 |
 |