Transient SSS130313:161726-232948
RA           Dec (2000)
244.36003      -23.49665
Rough Mag:
17.1
Discovery data
Current lightcurve
Pre and post-discovery SSS images
SDSS data
Images from other surveys
P60 Follow-up
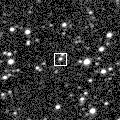
Pre-discovery 3.6' Siding Spring Survey coadd image (transient location marked with 0)
N is towards the top and E is to the left.
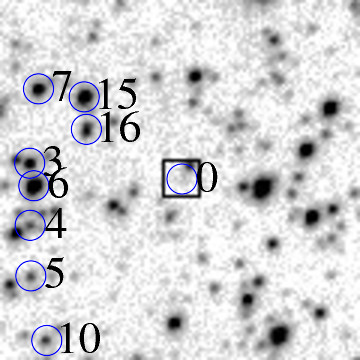
ID    RA         Dec (2000)      mag      delmag    delra (")    deldec (")  PA (deg)

0    244.36003     -23.49665      17.1     0.0        0.0         0.0       0.0
6    244.38721     -23.49782      15.2    -2.0       89.7        -4.2      92.7
7    244.38622     -23.48170      16.2    -1.0       86.5        53.8      58.1
15    244.37794     -23.48309      15.6    -1.6       59.1        48.8      50.5
16    244.37758     -23.48850      17.0    -0.2       57.9        29.3      63.1
19    244.37231     -23.50132      16.8    -0.3       40.5       -16.8     112.5
22    244.36925     -23.49881      17.9     0.8       30.4        -7.8     104.3
25    244.36182     -23.52072      16.1    -1.0        5.9       -86.7     176.1
26    244.35898     -23.49452      17.6     0.4       -3.5         7.7     335.7
27    244.35831     -23.48399      17.7     0.5       -5.7        45.6     352.9
28    244.35788     -23.47959      16.3    -0.8       -7.1        61.4     353.4
38    244.34927     -23.49812      17.6     0.5      -35.5        -5.3     261.5
39    244.34852     -23.51720      16.4    -0.8      -38.0       -74.0     207.2
41    244.34660     -23.51392      17.6     0.5      -44.3       -62.2     215.5
43    244.34582     -23.49819      14.4    -2.8      -46.9        -5.5     263.3
46    244.34383     -23.47344      17.4     0.2      -53.5        83.6     327.4
47    244.34389     -23.50751      17.4     0.3      -53.3       -39.1     233.7
49    244.34293     -23.47998      17.9     0.8      -56.5        60.0     316.7
55    244.33776     -23.49195      15.8    -1.4      -73.5        16.9     283.0
58    244.33678     -23.50312      15.6    -1.5      -76.8       -23.3     253.1
59    244.33541     -23.51916      17.3     0.2      -81.3       -81.0     225.1
62    244.33344     -23.48499      15.5    -1.6      -87.8        42.0     295.6
65    244.33297     -23.50181      17.2     0.1      -89.3       -18.6     258.3
| Image 1 | Image 2 |
 |
 |
| Image 3 | Image 4 |
 |
 |