Transient SSS130314:074026-414351
RA           Dec (2000)
115.10813      -41.73087
Rough Mag:
14.6
Discovery data
Current lightcurve
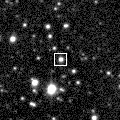
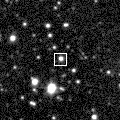
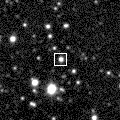
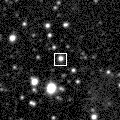
Pre and post-discovery SSS images
SDSS data
Images from other surveys
P60 Follow-up
Pre-discovery 3.6' Siding Spring Survey coadd image (transient location marked with 0)
N is towards the top and E is to the left.
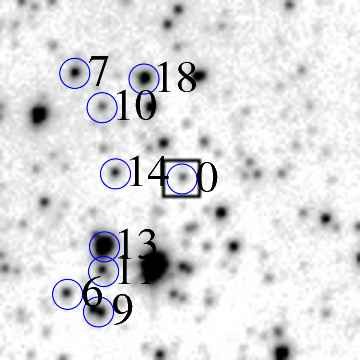
ID    RA         Dec (2000)      mag      delmag    delra (")    deldec (")  PA (deg)

0    115.10813     -41.73087      14.6     0.0        0.0         0.0       0.0
6    115.13442     -41.74998      17.0     2.4       70.6       -68.8     134.2
7    115.13197     -41.71322      16.4     1.7       64.0        63.5      45.2
9    115.12758     -41.75300      15.7     1.1       52.3       -79.7     146.7
10    115.12602     -41.71902      17.7     3.0       48.1        42.7      48.4
11    115.12630     -41.74628      16.5     1.9       48.8       -55.5     138.7
13    115.12600     -41.74218      13.4    -1.2       48.0       -40.7     130.3
14    115.12328     -41.73007      17.2     2.5       40.7         2.9      86.0
18    115.11657     -41.71436      15.5     0.8       22.7        59.4      20.9
20    115.11529     -41.71923      16.1     1.4       19.2        41.9      24.7
21    115.11490     -41.74558      11.5    -3.2       18.2       -53.0     161.0
24    115.11246     -41.72525      16.5     1.9       11.6        20.2      29.9
26    115.11006     -41.75053      16.7     2.1        5.2       -70.8     175.8
29    115.10804     -41.74601      16.1     1.5       -0.2       -54.5     180.3
31    115.10638     -41.73942      17.5     2.9       -4.7       -30.8     188.7
32    115.10442     -41.71407      15.7     1.1      -10.0        60.5     350.6
33    115.10331     -41.72497      17.8     3.2      -12.9        21.2     328.6
36    115.09976     -41.73689      16.0     1.4      -22.5       -21.7     226.1
38    115.09699     -41.74255      16.5     1.8      -29.9       -42.0     215.4
42    115.09336     -41.72854      17.9     3.3      -39.7         8.4     281.9
43    115.09172     -41.73053      17.8     3.1      -44.1         1.2     271.6
44    115.08883     -41.74748      17.3     2.6      -51.9       -59.8     220.9
47    115.08674     -41.75086      16.3     1.7      -57.5       -72.0     218.6
48    115.08593     -41.73033      17.9     3.3      -59.6         1.9     271.9
| Image 1 | Image 2 |
 |
 |
| Image 3 | Image 4 |
 |
 |