Transient SSS130502:104813-395620
RA           Dec (2000)
162.05491      -39.93886
Rough Mag:
13.9
Discovery data
Current lightcurve
Pre and post-discovery SSS images
SDSS data
Images from other surveys
P60 Follow-up
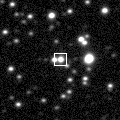
Pre-discovery 3.6' Siding Spring Survey coadd image (transient location marked with 0)
N is towards the top and E is to the left.
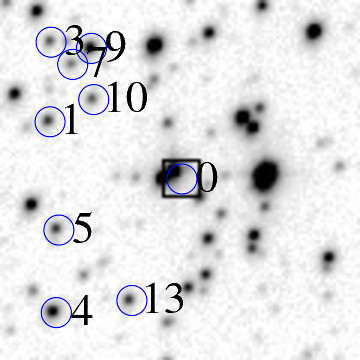
ID    RA         Dec (2000)      mag      delmag    delra (")    deldec (")  PA (deg)

0    162.05491     -39.93886      13.9     0.0        0.0         0.0       0.0
1    162.08381     -39.92943      16.8     2.9       79.8        33.9      66.9
3    162.08347     -39.91617      17.3     3.3       78.8        81.7      44.0
4    162.08272     -39.96120      15.9     2.0       76.8       -80.4     136.3
5    162.08204     -39.94746      16.8     2.9       74.9       -31.0     112.5
7    162.07881     -39.91990      17.6     3.7       66.0        68.3      44.0
9    162.07472     -39.91725      16.0     2.0       54.7        77.8      35.1
10    162.07428     -39.92578      17.3     3.4       53.5        47.1      48.6
13    162.06628     -39.95928      16.8     2.9       31.4       -73.5     156.9
15    162.06094     -39.92285      17.5     3.5       16.6        57.6      16.1
16    162.06065     -39.91688      14.2     0.2       15.8        79.1      11.3
17    162.05883     -39.93900      14.7     0.8       10.8        -0.5      92.7
18    162.05776     -39.92986      17.3     3.4        7.9        32.4      13.6
19    162.05765     -39.96293      17.6     3.7        7.6       -86.7     175.0
22    162.05315     -39.95725      16.3     2.4       -4.9       -66.2     184.2
23    162.05082     -39.94203      16.3     2.4      -11.3       -11.4     224.7
24    162.04953     -39.95507      16.5     2.5      -14.9       -58.4     194.3
25    162.04906     -39.91488      16.0     2.1      -16.1        86.3     349.4
26    162.04895     -39.94906      16.3     2.3      -16.5       -36.7     204.1
29    162.04625     -39.94494      17.5     3.5      -23.9       -21.9     227.5
31    162.04153     -39.92884      14.4     0.5      -36.9        36.1     314.3
32    162.03933     -39.93053      15.2     1.2      -43.0        30.0     304.9
34    162.03927     -39.95067      17.0     3.1      -43.2       -42.5     225.4
35    162.03903     -39.94857      15.8     1.9      -43.8       -35.0     231.4
36    162.03778     -39.92723      16.9     3.0      -47.3        41.9     311.5
38    162.03670     -39.94369      17.0     3.0      -50.3       -17.4     250.9
39    162.03647     -39.93852      11.9    -2.1      -50.9         1.2     271.4
41    162.02603     -39.91455      14.5     0.6      -79.7        87.5     317.7
| Image 1 | Image 2 |
 |
 |
| Image 3 | Image 4 |
 |
 |