Transient SSS130514:082144-534419
RA           Dec (2000)
125.43441      -53.73867
Rough Mag:
17.8
Discovery data
Current lightcurve
Pre and post-discovery SSS images
SDSS data
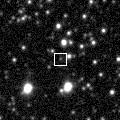
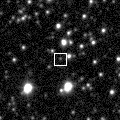
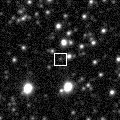
Images from other surveys
P60 Follow-up
Pre-discovery 3.6' Siding Spring Survey coadd image (transient location marked with 0)
N is towards the top and E is to the left.
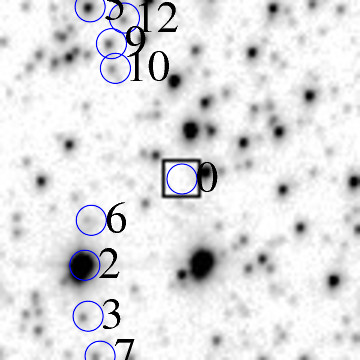
ID    RA         Dec (2000)      mag      delmag    delra (")    deldec (")  PA (deg)

0    125.43441     -53.73867      17.8     0.0        0.0         0.0       0.0
2    125.46291     -53.75276      11.3    -6.5       60.7       -50.7     129.9
3    125.46244     -53.76125      17.7    -0.1       59.7       -81.3     143.7
6    125.46072     -53.74531      17.8    -0.1       56.0       -23.9     113.1
9    125.45351     -53.71603      17.0    -0.8       40.7        81.5      26.5
10    125.45262     -53.72015      17.7    -0.2       38.8        66.7      30.2
15    125.44387     -53.71513      16.3    -1.5       20.1        84.7      13.4
16    125.44432     -53.74257      17.5    -0.3       21.1       -14.0     123.6
17    125.44163     -53.73458      16.2    -1.6       15.4        14.7      46.2
18    125.44102     -53.72782      17.3    -0.5       14.1        39.1      19.8
20    125.43532     -53.72226      14.6    -3.2        1.9        59.1       1.9
21    125.43435     -53.75450      15.8    -2.0       -0.1       -57.0     180.1
22    125.43114     -53.73048      13.7    -4.1       -7.0        29.5     346.7
24    125.42913     -53.71731      16.7    -1.1      -11.2        76.9     351.7
25    125.42895     -53.75265      11.6    -6.3      -11.6       -50.3     193.0
26    125.42670     -53.72595      15.8    -2.1      -16.4        45.8     340.3
28    125.42693     -53.73753      14.8    -3.0      -15.9         4.1     284.4
30    125.42550     -53.73066      16.1    -1.8      -19.0        28.8     326.7
34    125.41734     -53.74929      16.6    -1.2      -36.3       -38.2     223.6
35    125.41635     -53.73276      15.8    -2.0      -38.5        21.3     299.0
37    125.41580     -53.73643      17.4    -0.4      -39.6         8.1     281.5
39    125.41568     -53.75375      17.1    -0.7      -39.9       -54.3     216.3
40    125.41317     -53.71781      15.8    -2.0      -45.2        75.1     328.9
41    125.41307     -53.72724      17.5    -0.4      -45.4        41.1     312.2
44    125.41135     -53.75252      16.1    -1.8      -49.1       -49.9     224.6
45    125.40894     -53.72695      17.5    -0.4      -54.2        42.2     307.9
48    125.40607     -53.71912      18.0     0.1      -60.3        70.4     319.4
49    125.40652     -53.73077      15.3    -2.5      -59.4        28.4     295.6
52    125.40541     -53.74077      16.1    -1.8      -61.7        -7.6     263.0
| Image 1 | Image 2 |
 |
 |
| Image 3 | Image 4 |
 |
 |